L'Île-Bizard-Sainte-Geneviève
A borough of Montréal, in numbers and in plain language.
Montréal · Arrondissement
L'Île-Bizard-Sainte-Geneviève
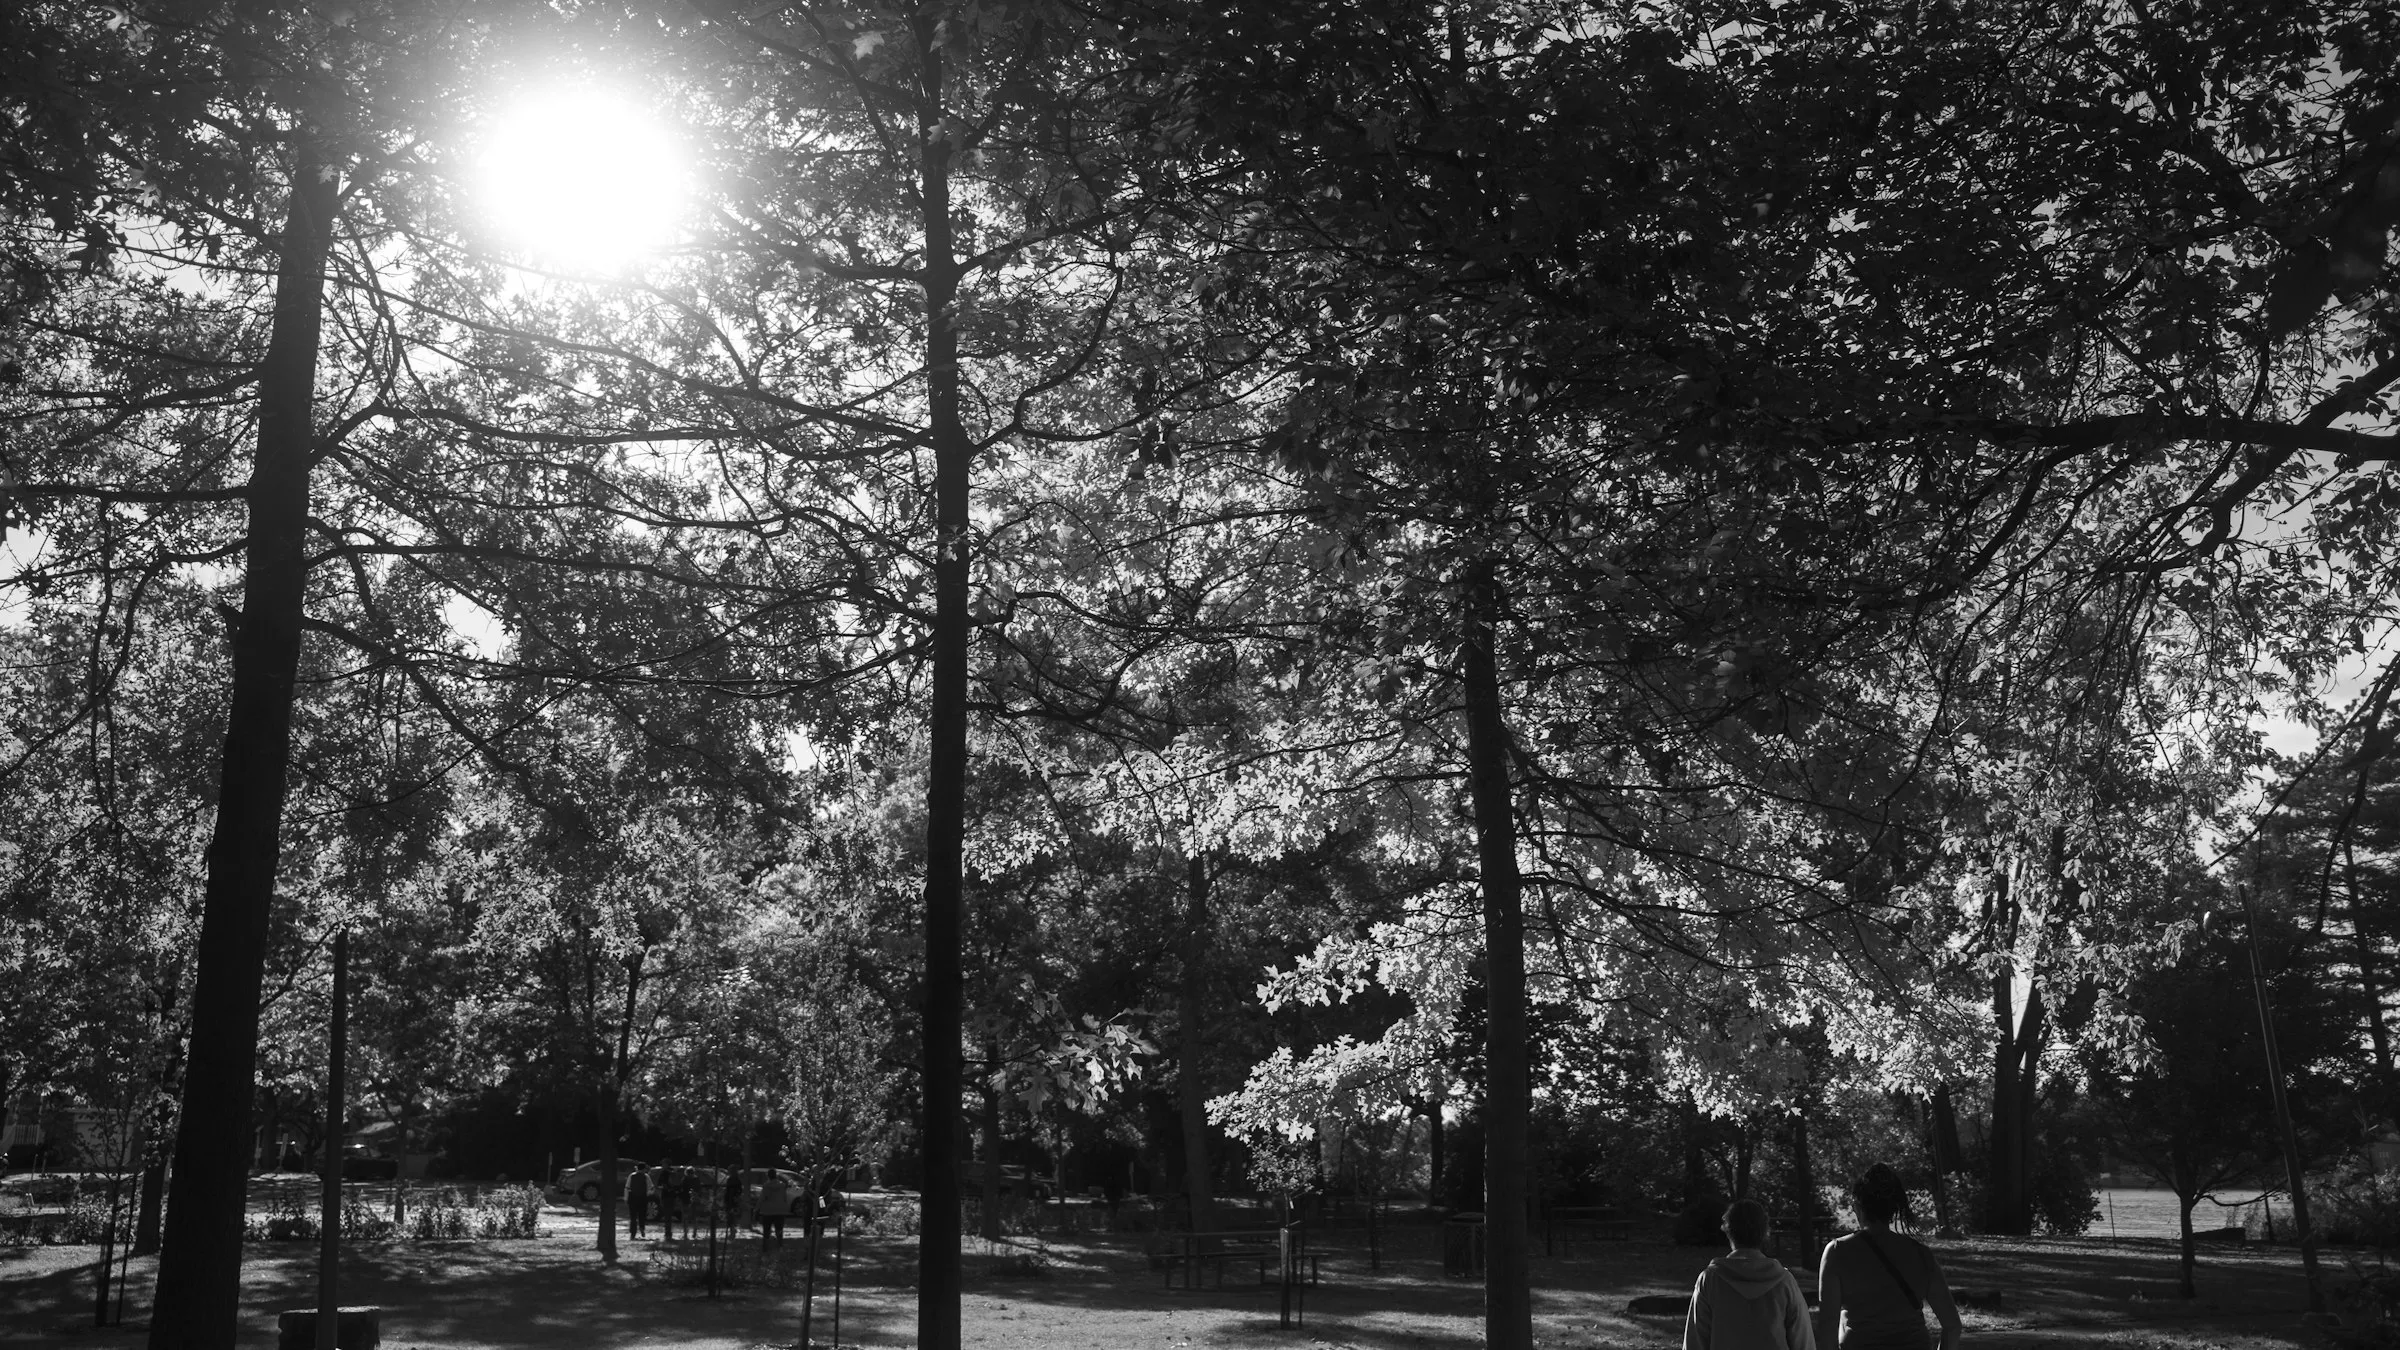
Promeneurs dans un parc de L'Île-Bizard-Sainte-Geneviève en noir et blanc
Photo · Unsplash · @skirebel
Page coverage
11/11
- Geography
- Demographics
- Housing
- Safety
- Environment
- Transit
- Living
- Schools
- Public services
- Culture
- Risks
About
18,097 residents call L'Île-Bizard-Sainte-Geneviève home, a borough of Montréal, which stretches across 36.24 km², ranking 19th of 19. 3 schools per the MEQ register. Montreal police data over the past 24 months log 59 incidents per 10,000 residents a year.
Data last updated on .
Quick facts
- Type
- Borough of Montréal (19 total)
- Area
- 36.24 km²
- Sources
- Statistics Canada · MEQ · SPVM · City of Montreal
Closest neighbours
L'Île-Bizard-Sainte-Geneviève in Quebec's rankings
Neighbourhood profile
Composite indices, 4 weighted criteria each. See the methodology for the weight details.
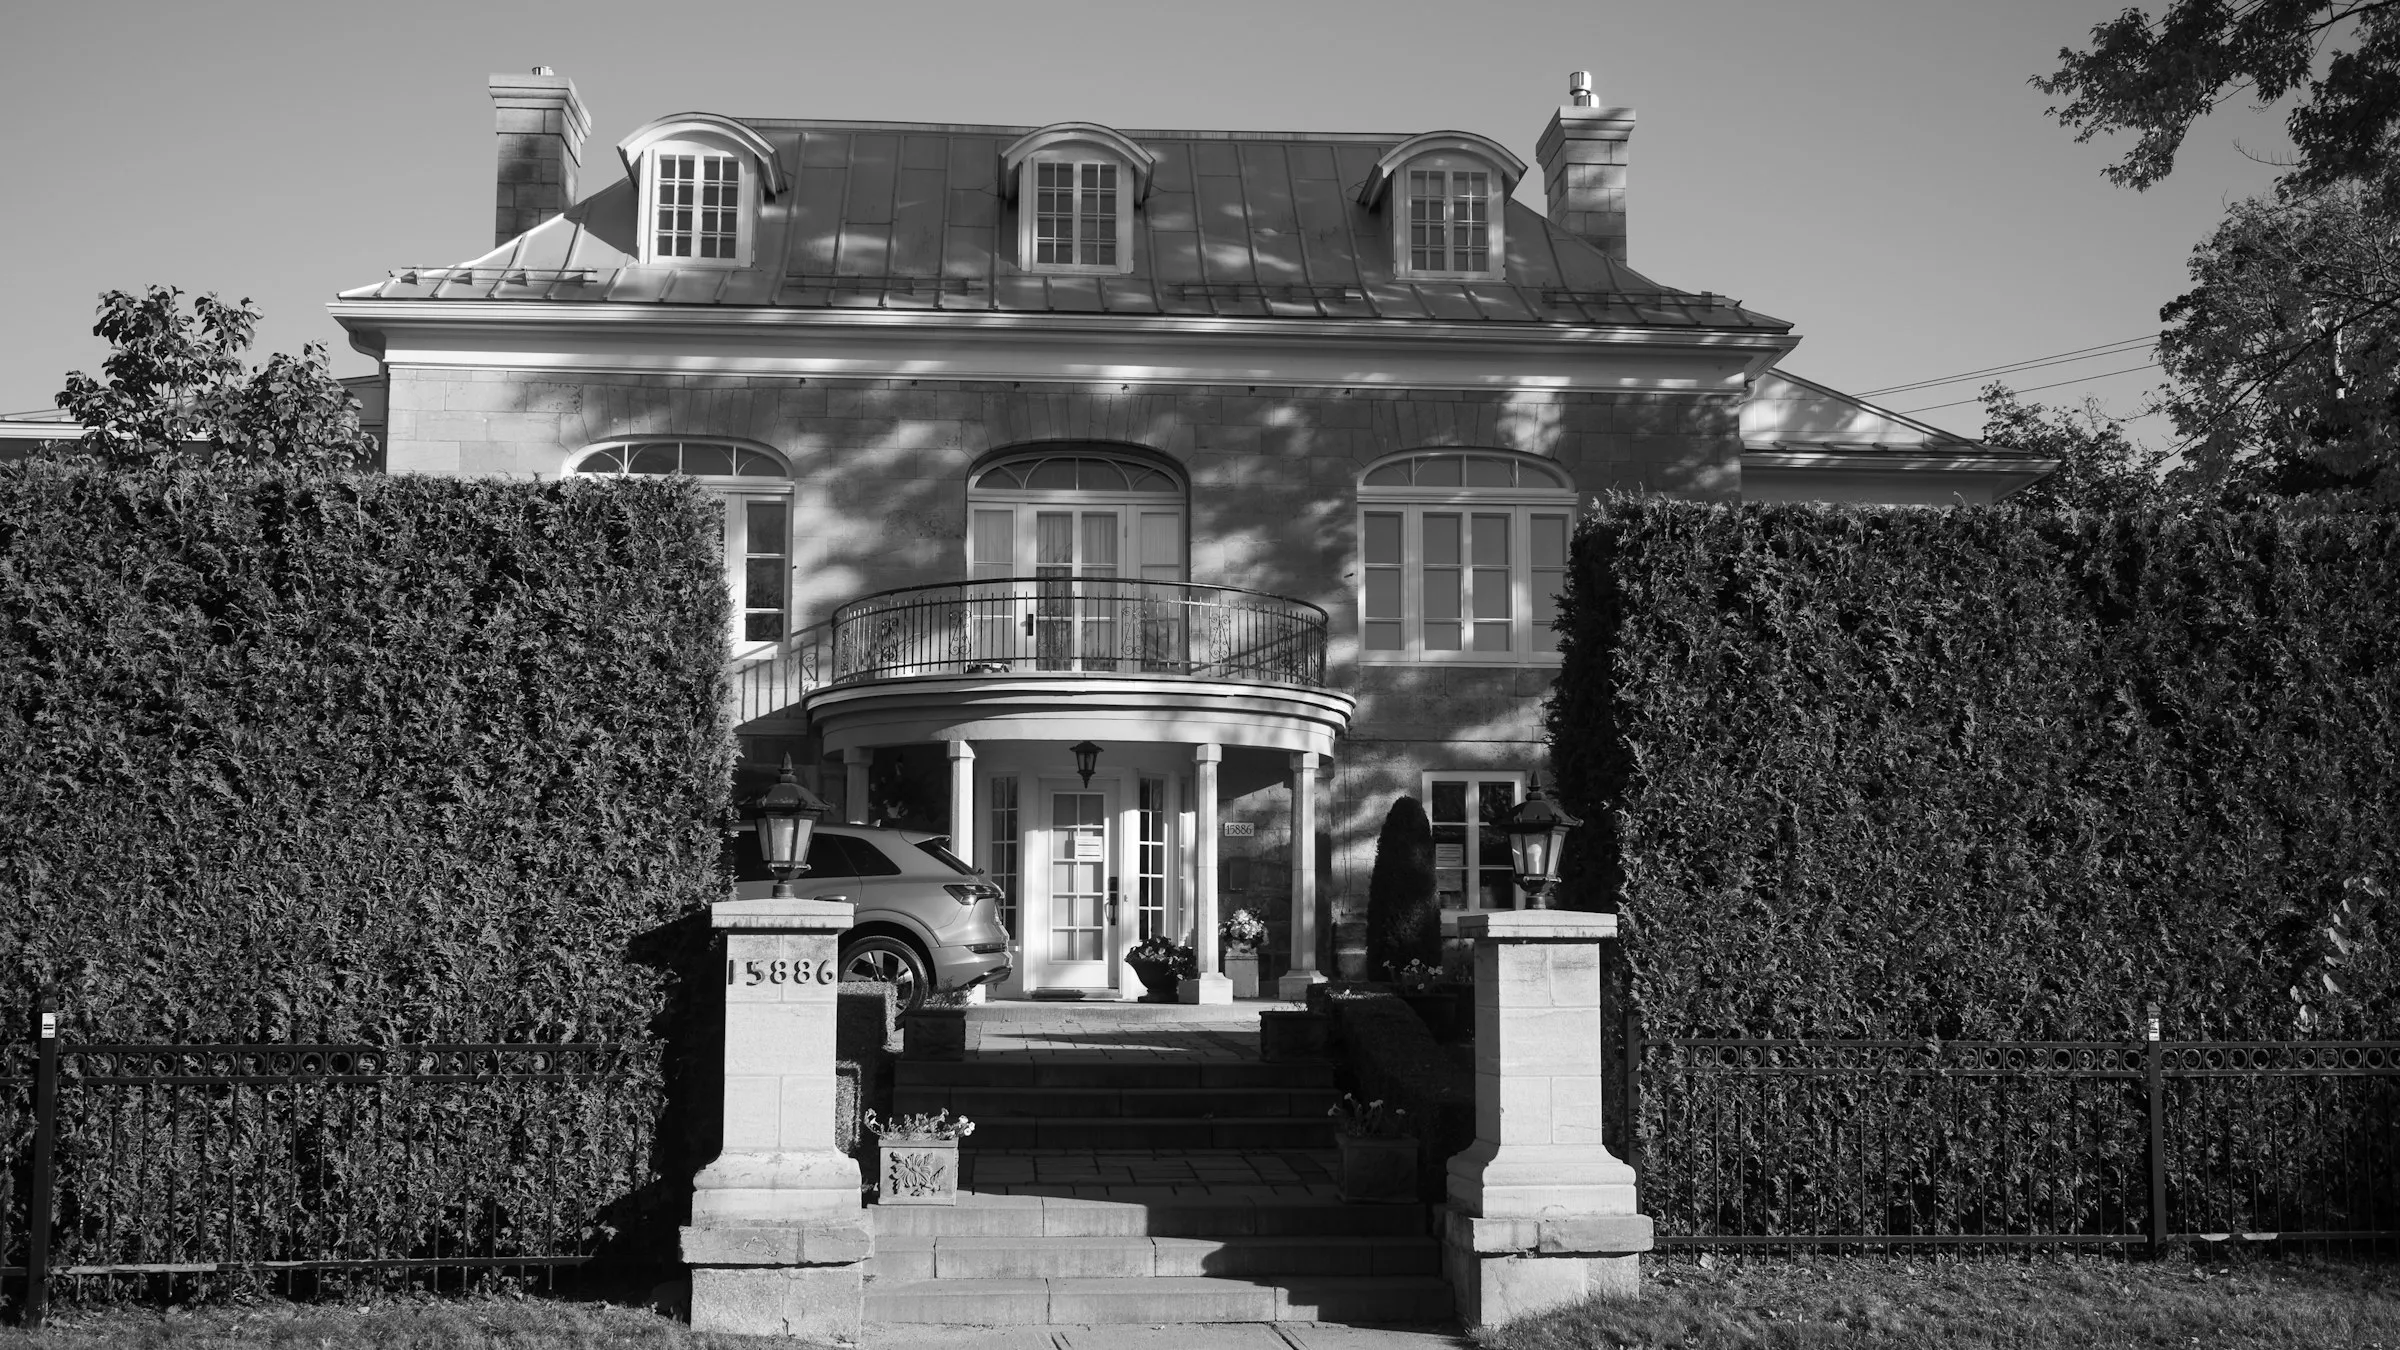
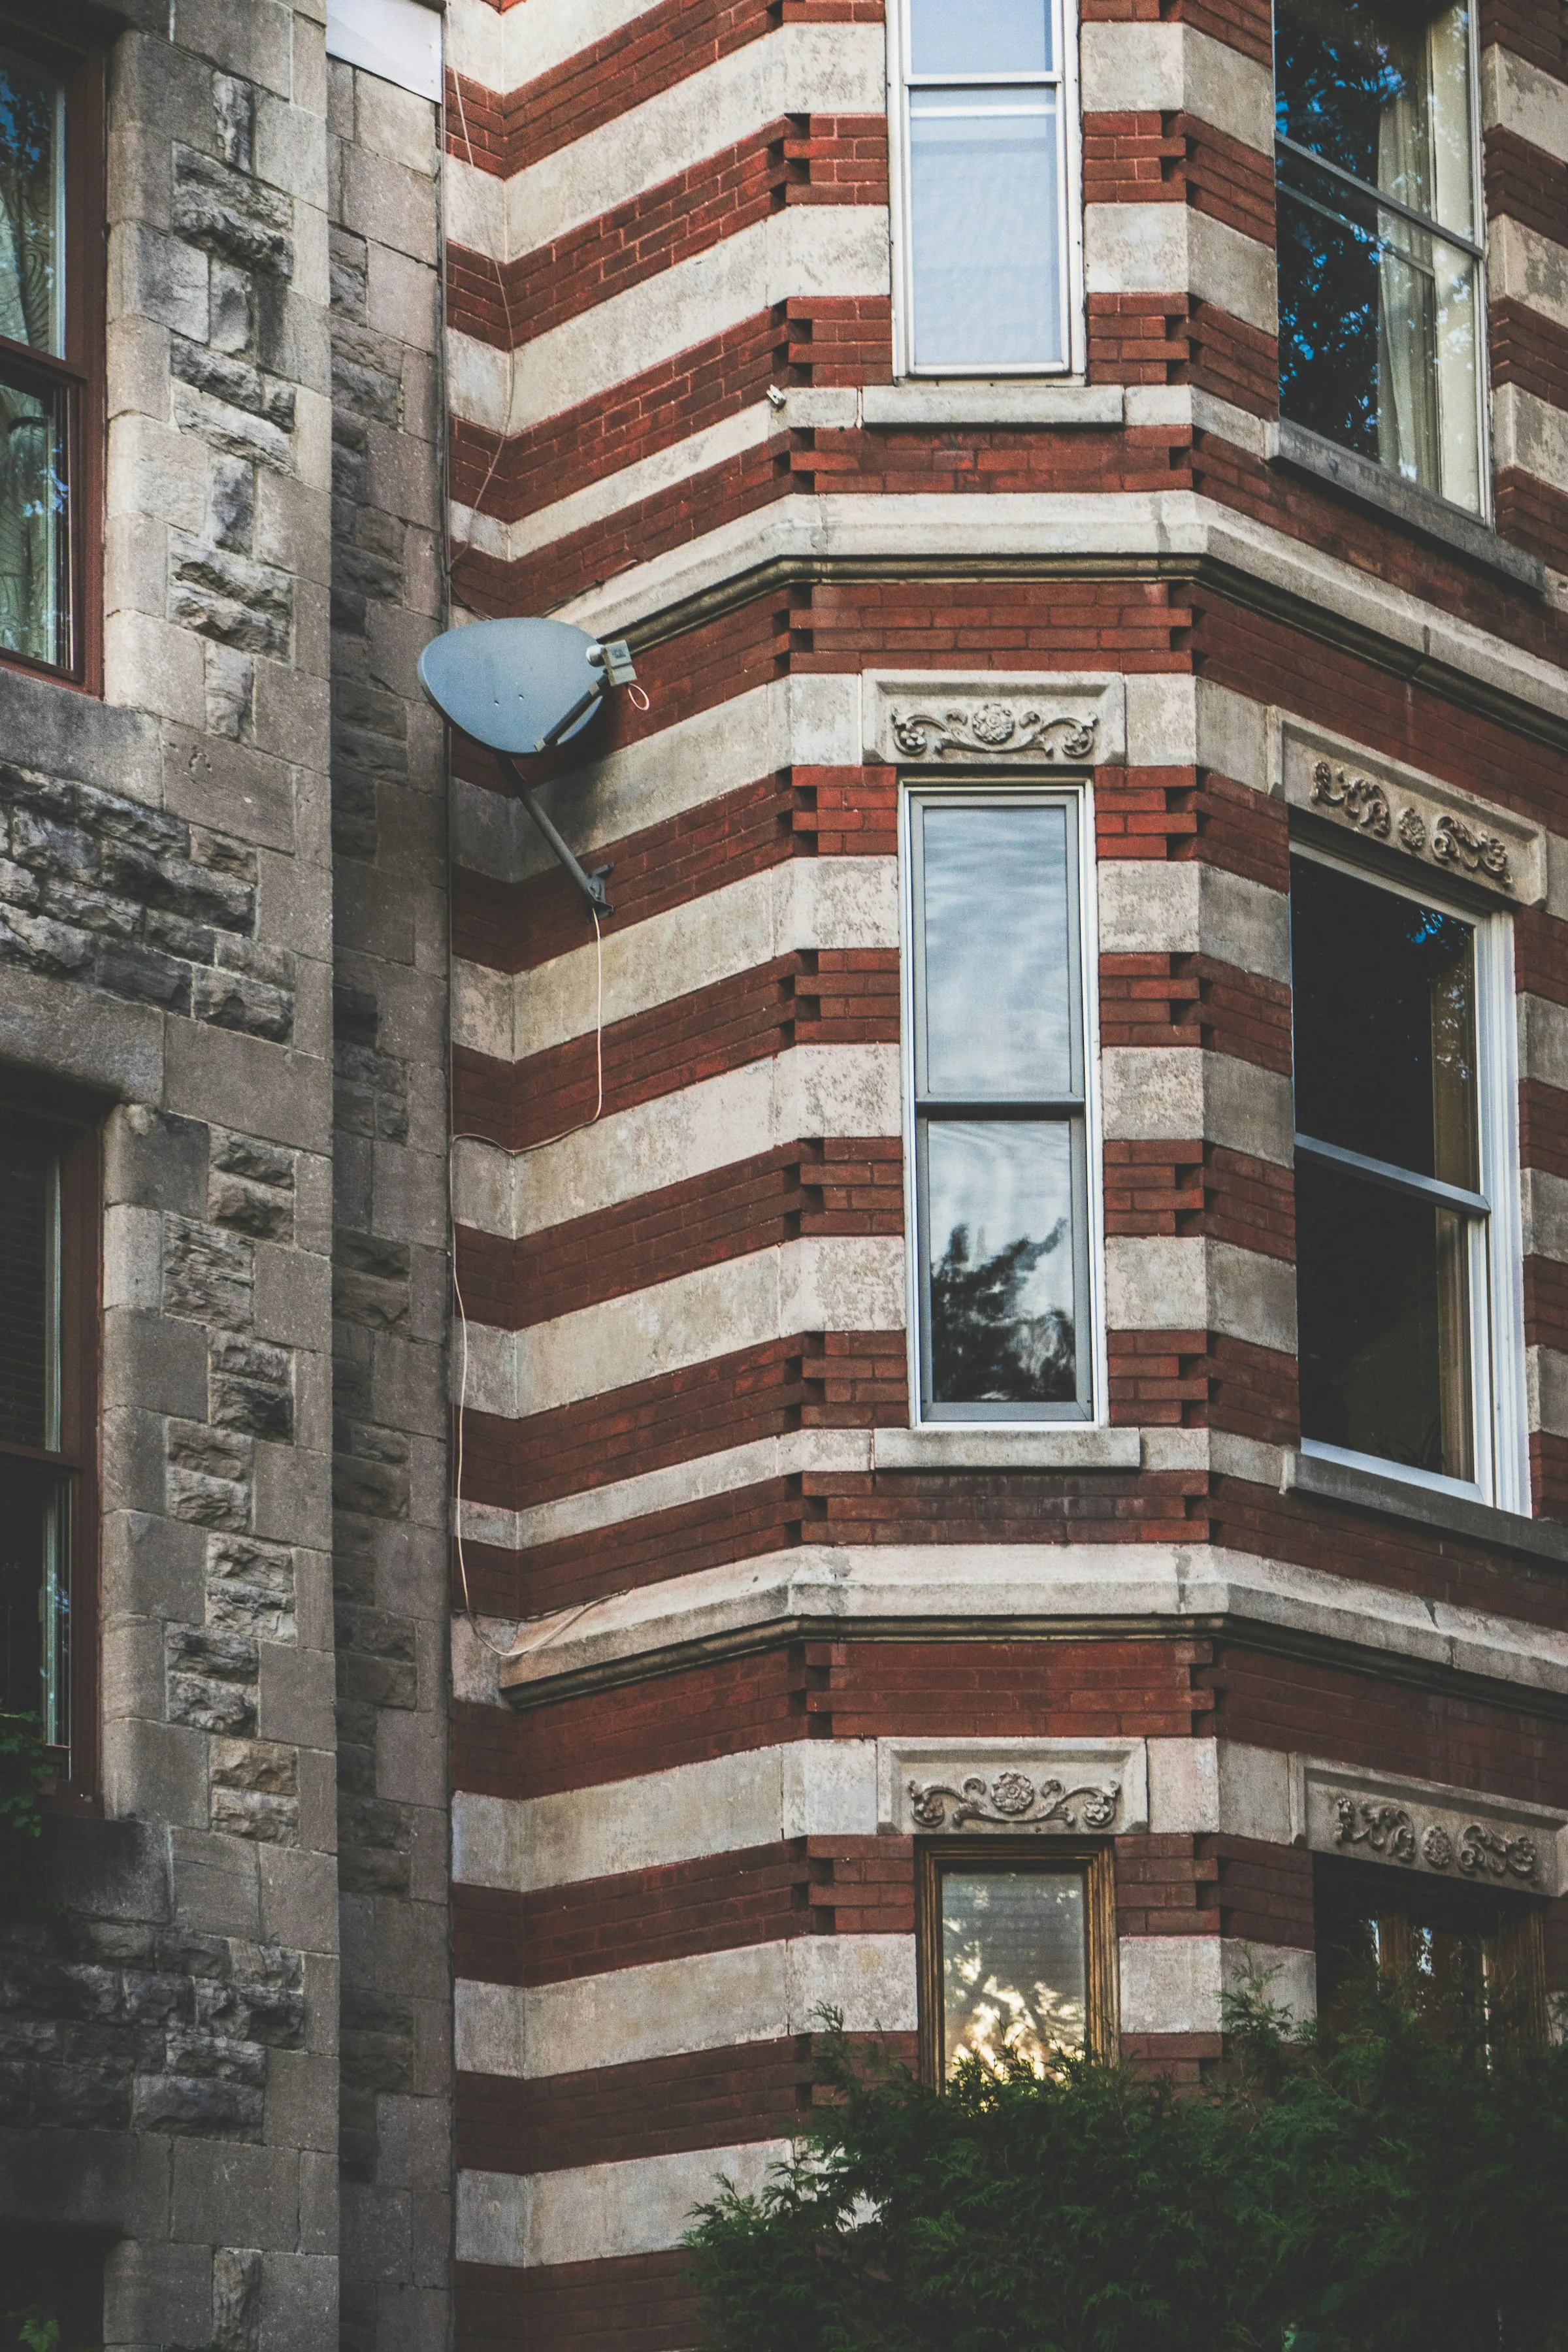
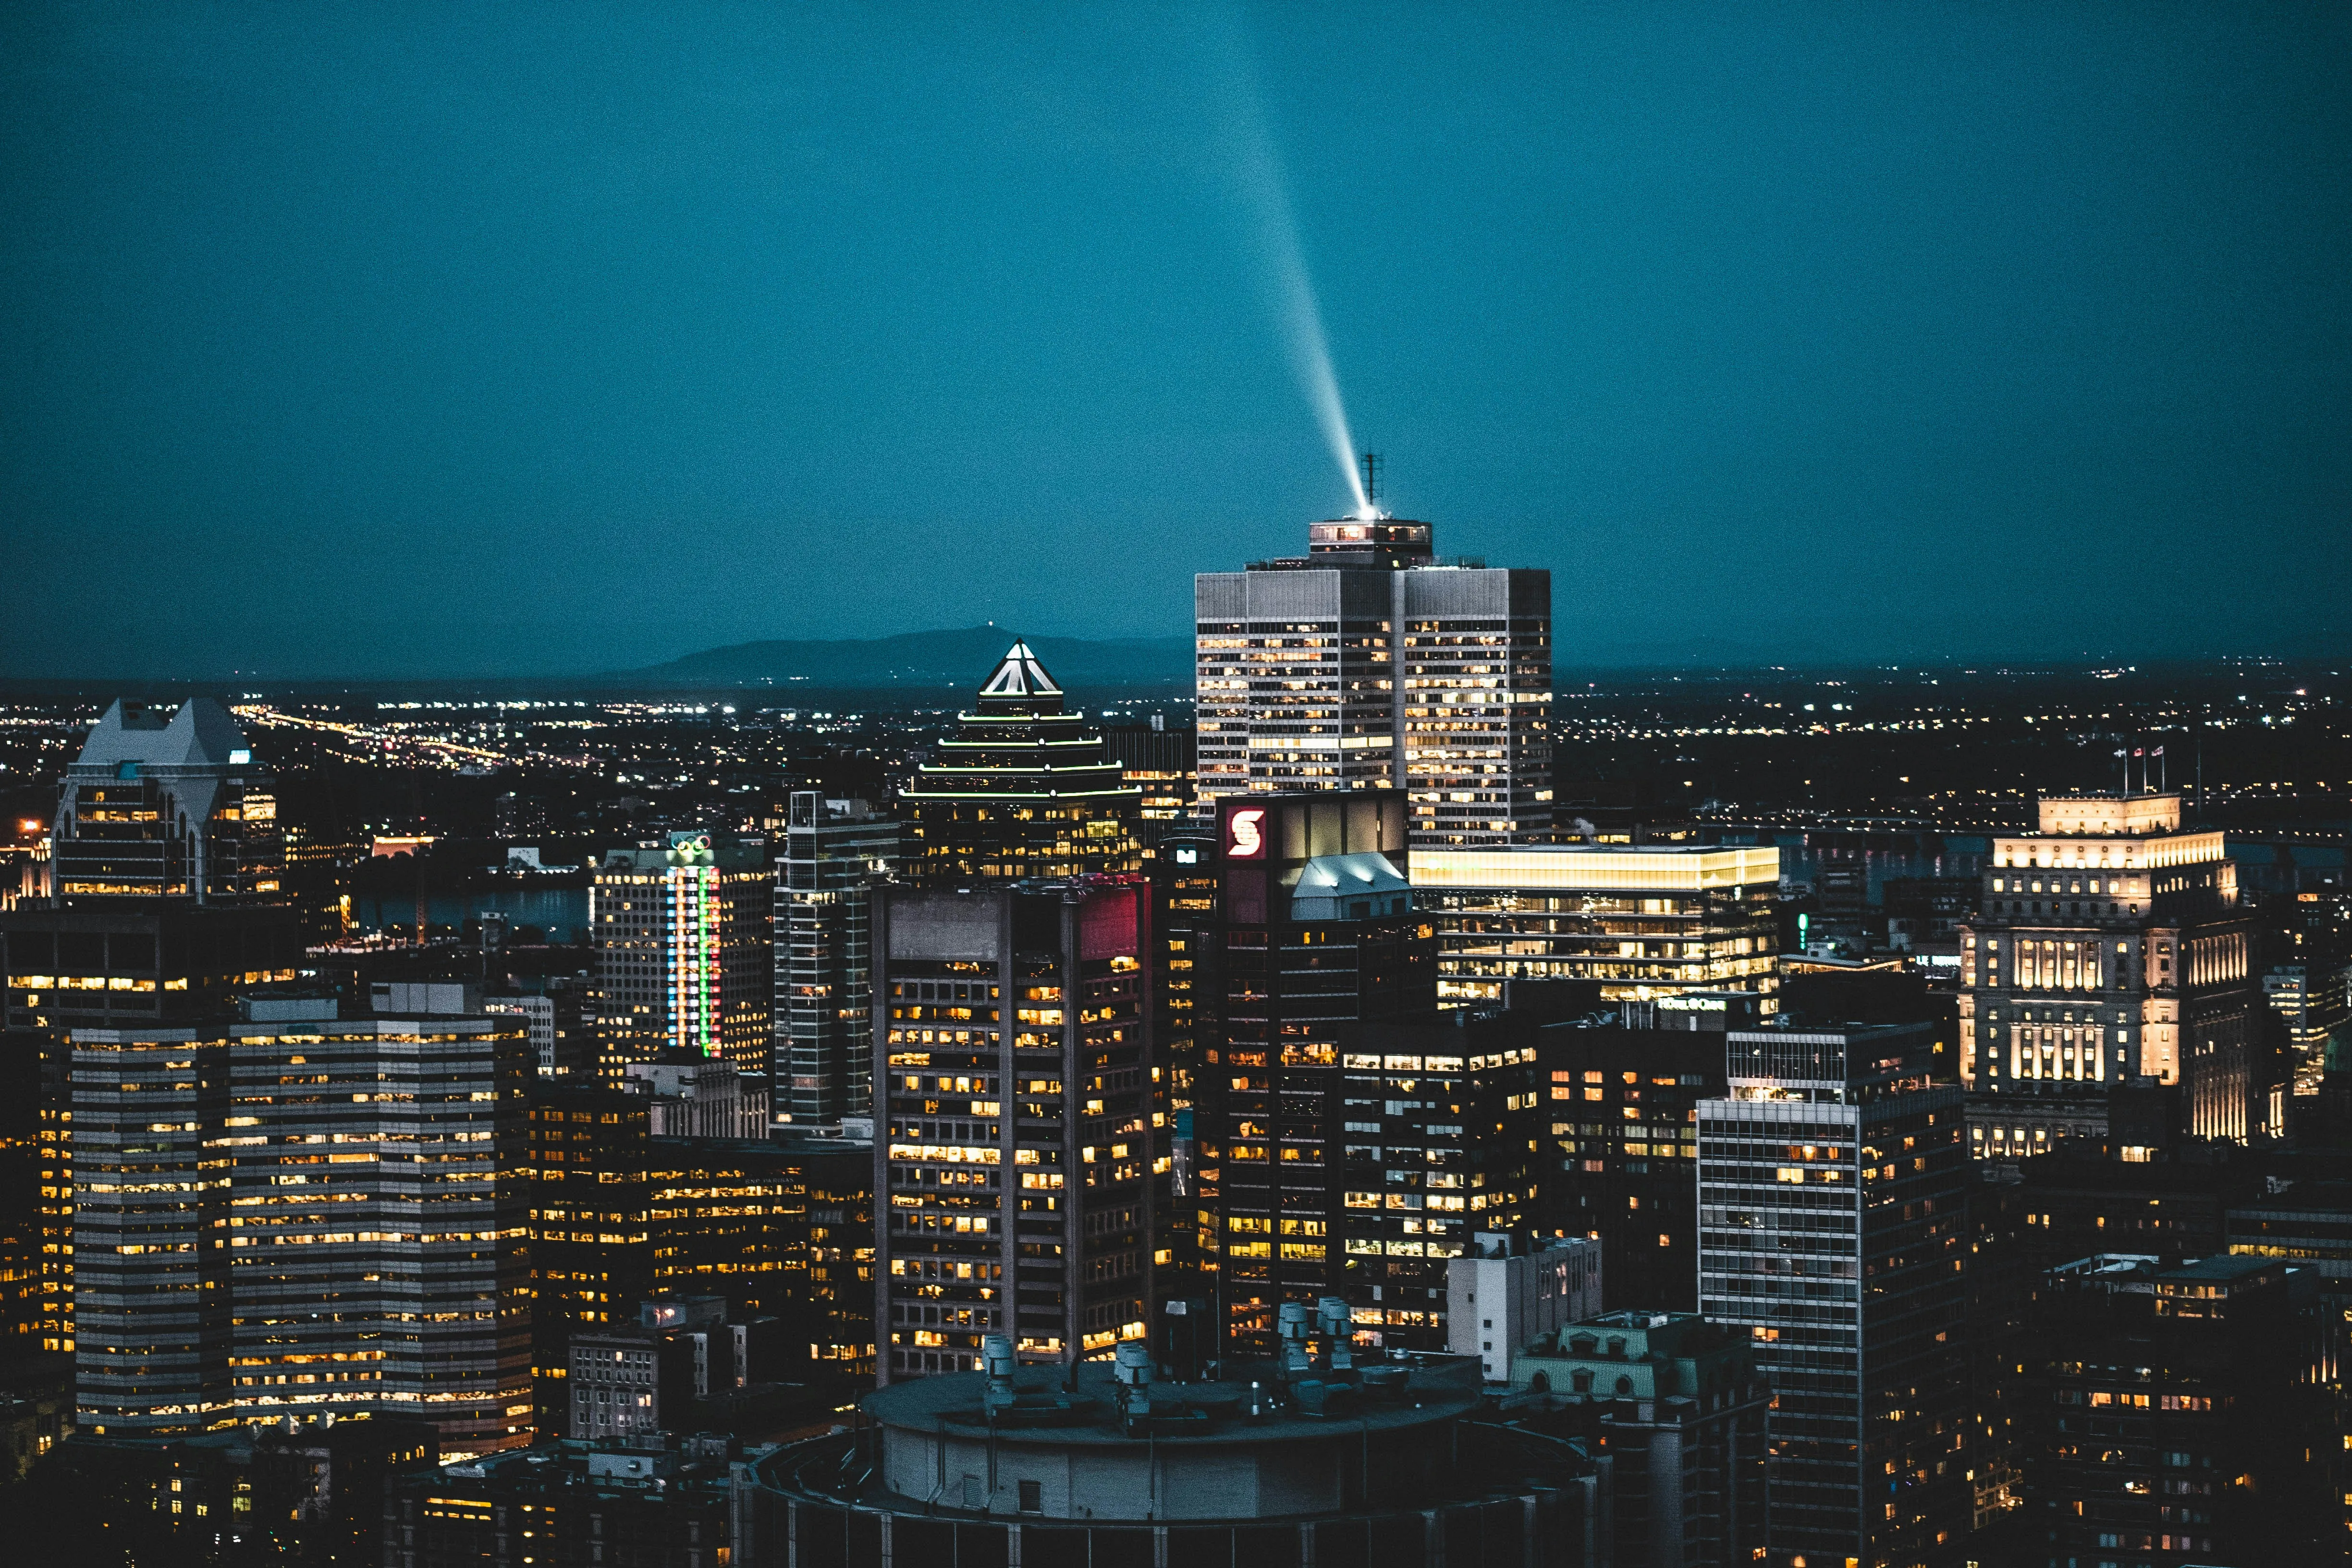
Photos
L'Île-Bizard-Sainte-Geneviève,
in pictures.
Who lives here
L'Île-Bizard-Sainte-Geneviève by the numbers.
Population · Census
18 097residents
18,097 residents live in L'Île-Bizard-Sainte-Geneviève, ranking 19th of Montréal's 19 boroughs by population (Statistics Canada).
Source
Statistique Canada
Figures refresh with every new Statistics Canada release. Every source on this page is public and openly accessible.
The housing stock
L'Île-Bizard-Sainte-Geneviève in homes.
Occupied homes
7 445homes
L'Île-Bizard-Sainte-Geneviève has 7,445 occupied homes according to Ville de Montréal, rôle d'évaluation foncière. Median building construction year: 1986. Median monthly housing cost: $1,040.
Source
Ville de Montréal, rôle d'évaluation foncière
Updated when the next municipal assessment roll is published. All sources are public and consultable.
Median build year
1986
Single-family homes
69.2%
Households spending over 30% on housing
17.0%
Median housing cost
1,040$/mo
Geography
L'Île-Bizard-Sainte-Geneviève,
on the map.
The official borough boundary and its sub-neighbourhoods. Hover a zone to see its name and tree canopy rate.
Schools · MEQ
L'Île-Bizard-Sainte-Geneviève has
3 schools.
3 schools sit in L'Île-Bizard-Sainte-Geneviève per the Quebec Ministry of Education, a insufficient data school-density tier across Montreal's 19 boroughs.
3
Elementary
3
Public
Source: MEQ. Each school is linked to a borough based on its official address and the borough boundaries. For Fraser Institute rankings, see directly fraserinstitute.org.
Keep exploring
Compare L'Île-Bizard-Sainte-Geneviève with a neighbour.
Safety · SPVM
106 incidents per year
in L'Île-Bizard-Sainte-Geneviève.
Quiet living
ExcellentRead on residential quiet, compared with Montreal's 19 boroughs.
Source: Données publiques du SPVM, fenêtre 24 mois, comparé aux 19 arrondissements
Looking at the past 24 months (SPVM data), L'Île-Bizard-Sainte-Geneviève totals 106 incidents per year (59 per 10,000 residents). A excellent safety tier across Montreal's 19 boroughs.
A long window beats a snapshot: the calm of a neighbourhood reads over time, not in a single news month.
Source: SPVM. Boroughs with heavy commercial activity (downtown) mechanically show higher per-resident rates: activity there often targets non-residents.
Side by side?
Compare L'Île-Bizard-Sainte-Geneviève
with another place.
Go further
Considering L'Île-Bizard-Sainte-Geneviève ?
Tell us your project, we'll connect you with the right pro.
Tick as many pros as your project needs. Each one reaches out directly, no fees, no obligation.
Around · Montréal
The other boroughs,
one click away.
How about the neighbour?
Compare L'Île-Bizard-Sainte-Geneviève
side by side.
The same numbers aligned, two neighbourhoods side by side. You see the difference at a glance.
Pick another neighbourhood